
Massive Adds x402 Payments Access for AI Agents with Coinbase
Massive US stock data is now available to AI agents via x402. Pay per request in USDC on agent.massive.com, with no account or API key. Built with Coinbase.

editor
Introducing
Apr 30, 2026
When is Amazon's biggest day of the year? Most people, asked without thinking, will give you one of two answers. One half says Prime Day, the annual July spectacle invented by Amazon to manufacture a shopping holiday out of nothing. The other half says Black Friday, the invention that now blankets us in late-November emails for six straight weeks.Both answers are right, and both are wrong. It depends what you mean by "biggest", and it depends where you live.
This post is built on about 200,000 rows of aggregated European card-transaction data: daily spending at Amazon retail sites in the UK, Germany, France, Italy, Spain and a few smaller markets, running continuously from the start of 2016 to last week. It's the kind of signal that normally lives inside a hedge-fund research team. We recently got the data at Massive.com (disclaimer, where I work), and this was the first idea that came to mind as a project to play around with it. Oh, and the data is now available via our EU Consumer Spending APIs!
If you want the code, it's all on GitHub.
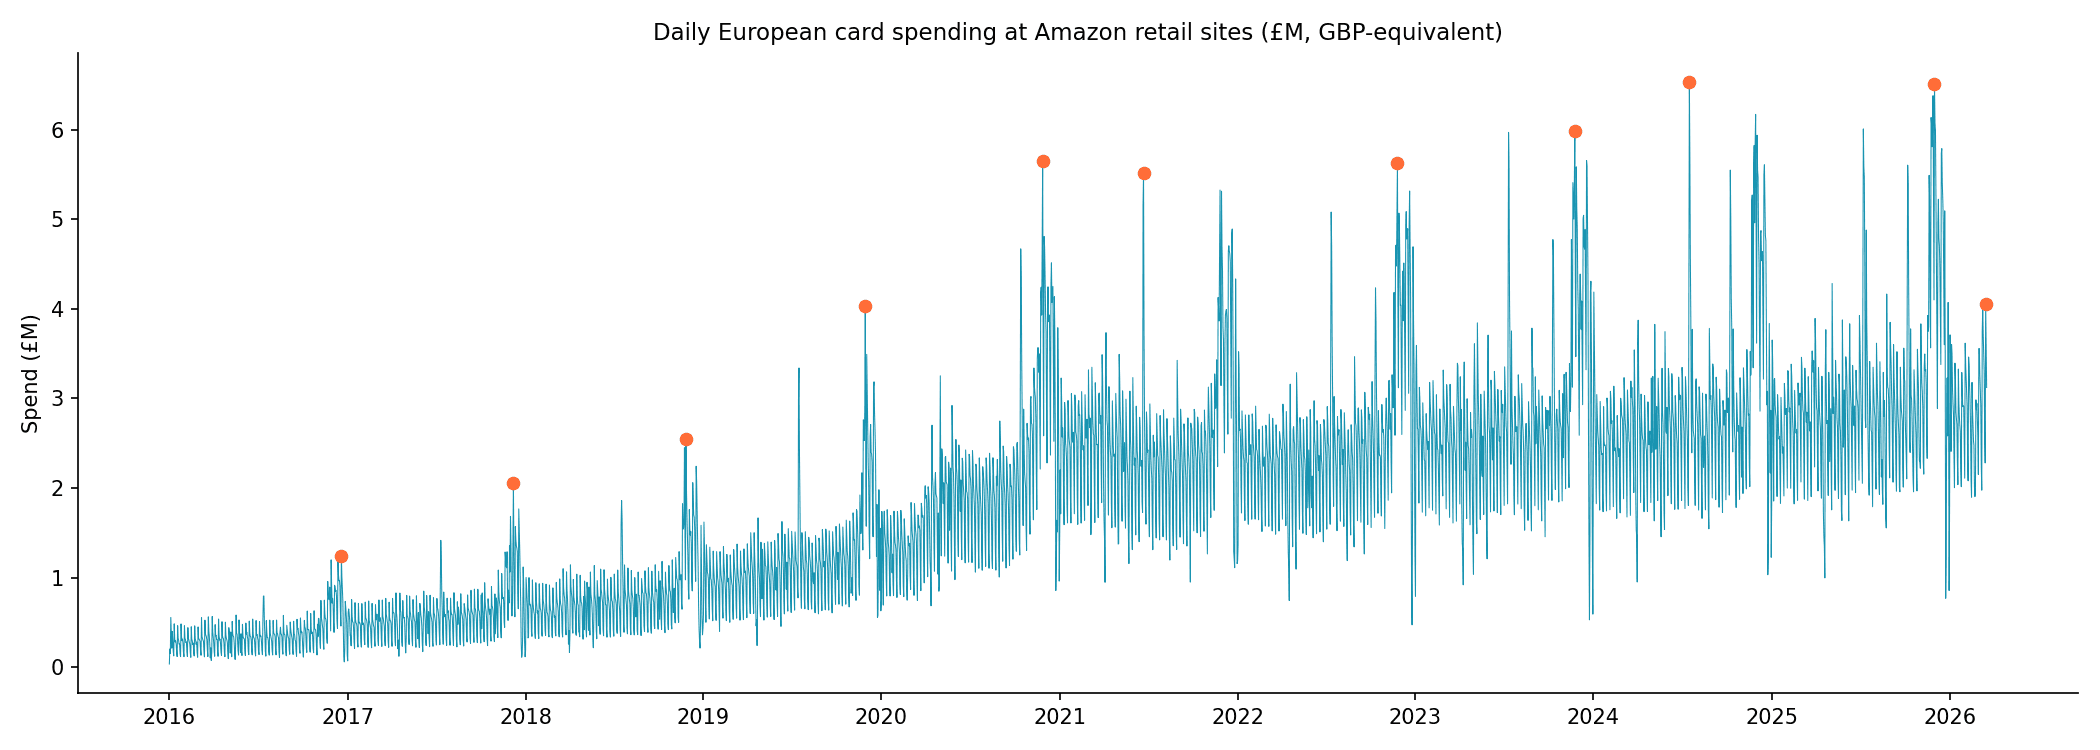
You can already see the answer is more complicated than "Prime Day" or "Black Friday". There are spikes of roughly comparable size every year in mid-July, late November and early December. The five biggest days ever (orange dots) are all in the last two years, and they're split between Prime Day and Black Friday week. So: which one wins?
Before answering that, look at the shape of a single calendar year. Here is 2024, day by day:
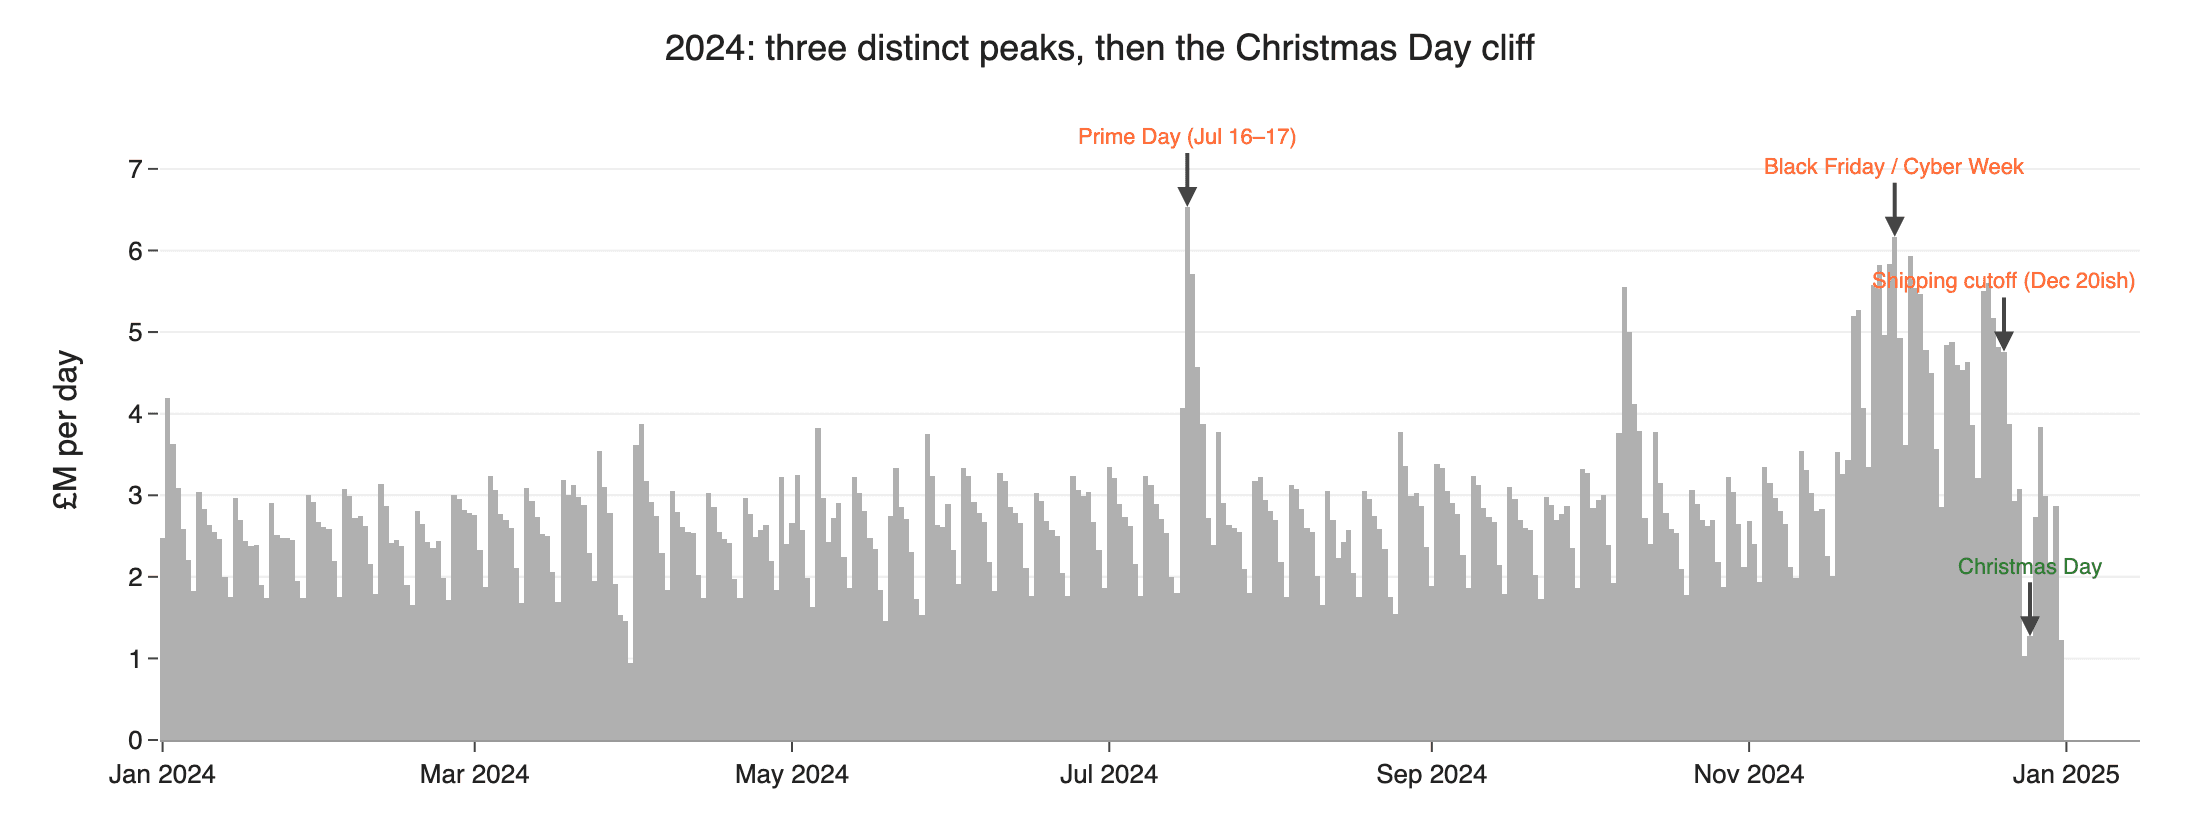
Three things stand out.
Prime Day is a single sharp spike in mid-July, about twice the surrounding baseline. It's visible from space. Amazon invented this event in 2015, expanded it from one day to two, and in 2025 stretched it to four. The spike has widened every time.
Black Friday and Cyber Week are not a spike. They're a plateau. From the Friday after American Thanksgiving through the following week, spending sits about 50% above baseline, and it stays elevated until around the 20th of December. This is the real engine of Amazon's holiday season. It starts earlier and lasts longer than most people realise.
The Christmas cliff is the most dramatic pattern in the data and nobody talks about it. Spending rises into the week of December 18–20, then collapses as the last-delivery deadlines close. On Christmas Eve 2024, card spend at Amazon was about one-sixth of its peak eight days earlier. Christmas Day itself is roughly dead, which makes perfect sense for a retailer whose entire proposition is "we ship it to you." Boxing Day recovers about half of it; by the 27th we're back to a normal level.
So there isn't one peak. There are three distinct ones, and they correspond to three different consumer behaviours: the manufactured holiday (Prime Day), the imported sale season (Black Friday → Cyber Monday → mid-December), and the shipping-deadline cliff.
Which of the first two is actually bigger? One natural way to ask: on the peak day itself, how much more does Europe spend than on a nearby ordinary day?
If we do that for every Prime Day and every Black Friday since 2016, the picture is surprisingly consistent:
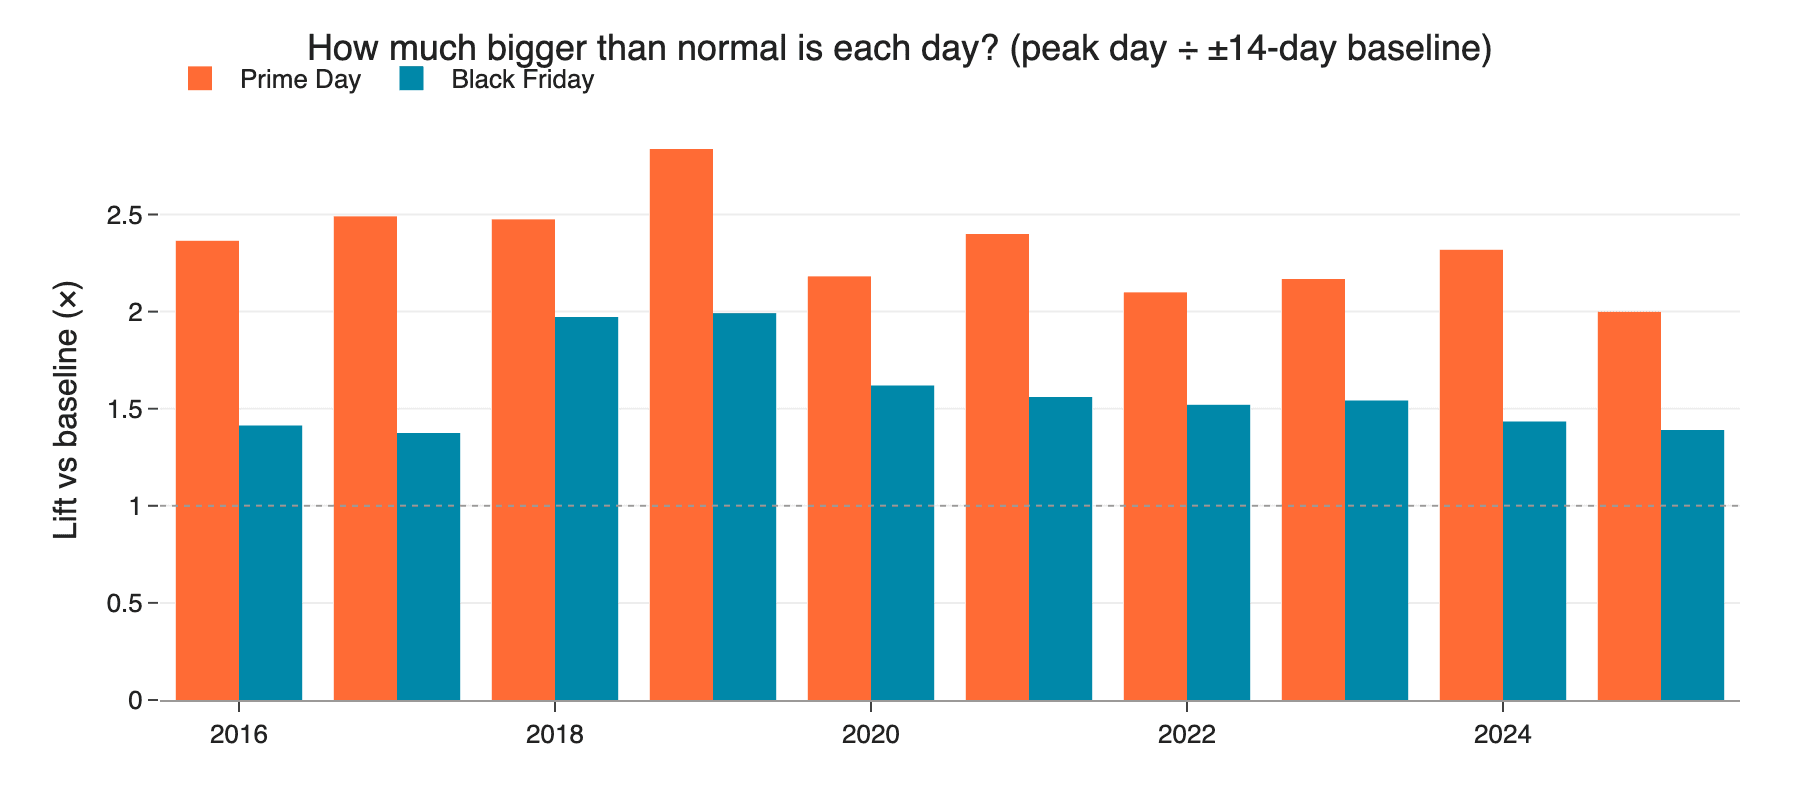
Prime Day wins on this measure every year. The best Prime Days (2019, 2023, 2024) are roughly 2.3–2.8× a normal day. Black Friday peaked at 2.0× in 2018 and hasn't hit that level since.
Two wrinkles are worth flagging before you declare a winner.
First, Prime Day's punch is fading. In 2019, peak Prime Day hit nearly 2.9× the surrounding baseline. In 2025, with the event now four days long, the peak day managed exactly 2.0×. As Amazon has stretched the window (one day, then two, then four, then added an October "Big Deal Days"), the per-day intensity has dropped. That's not a business problem for Amazon (the total is still growing), but it does mean the "single biggest day" narrative is weakening.
Second, Black Friday isn't really a single day. It kicks off a seven-to-ten-day period of elevated spending that Prime Day does not match. If you integrate the area under each peak rather than looking at maxima, Cyber Week wins every year. Which measure you care about depends on whether you're Amazon (the week) or a news editor writing a headline (the day).
Aggregating Europe into one number conceals something more interesting: the countries behave very differently from each other on Prime Day, and very similarly on Black Friday.
The chart below is the peak-day lift of each event by country for 2024, just the same lift calculation we did above computed separately for each market:
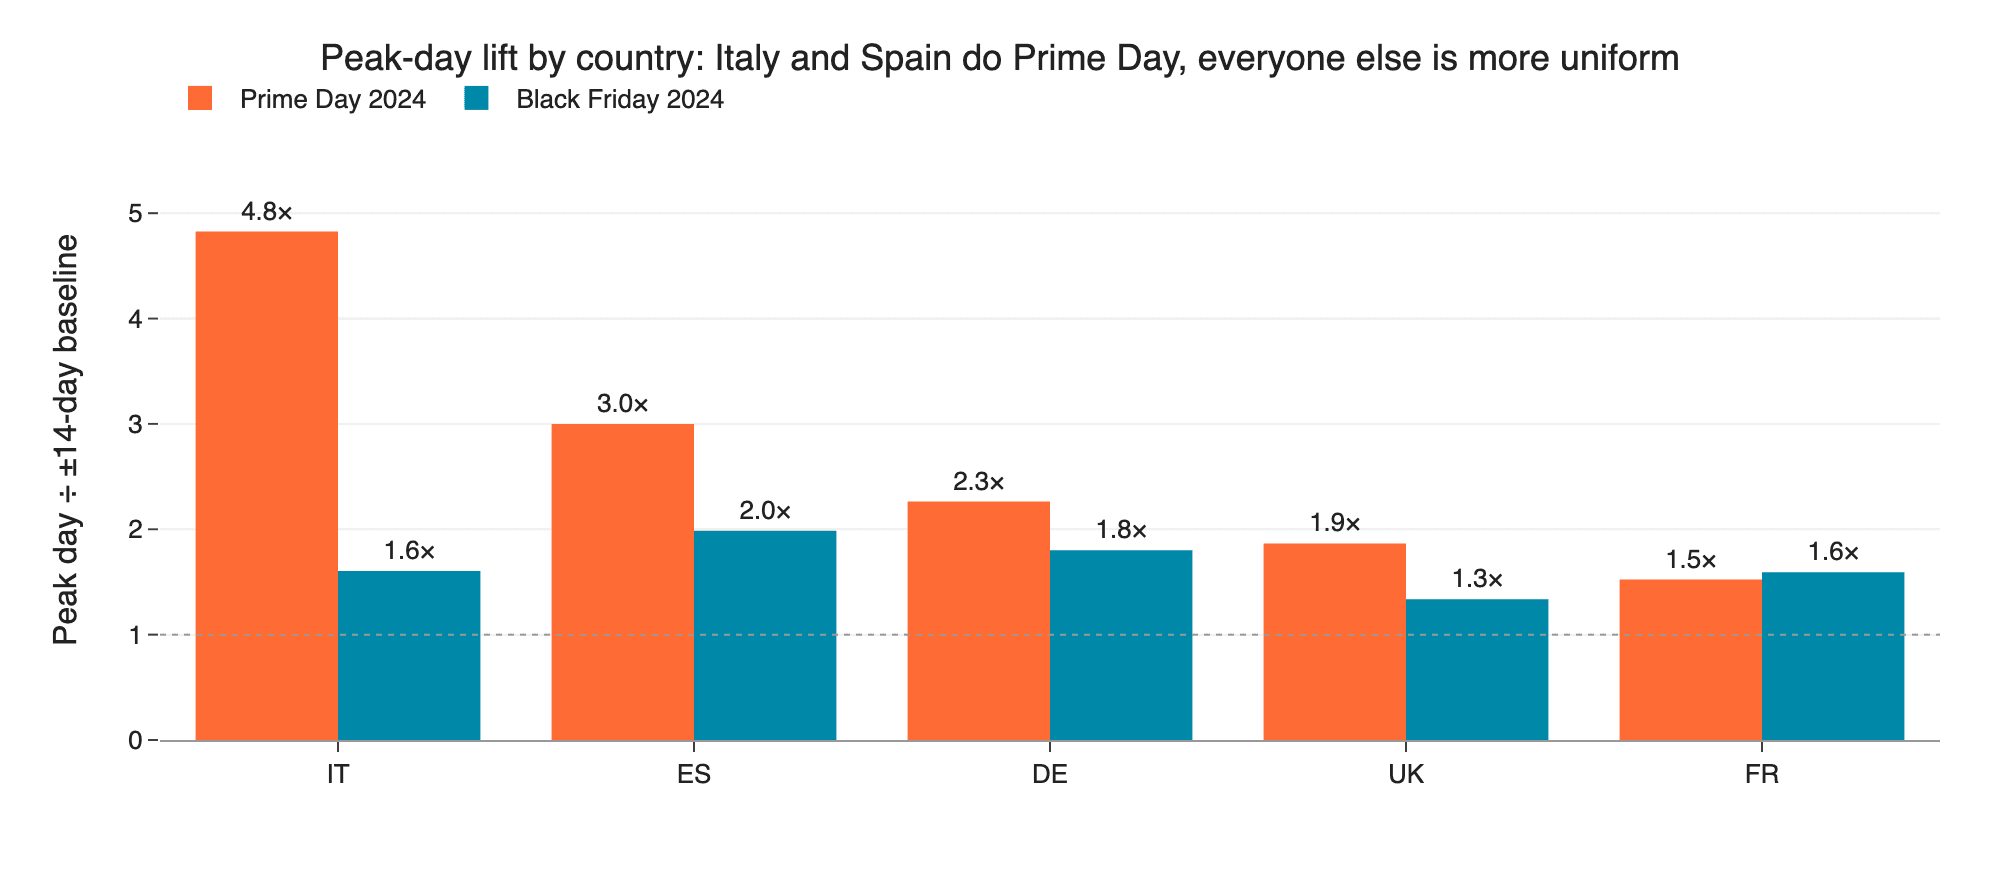
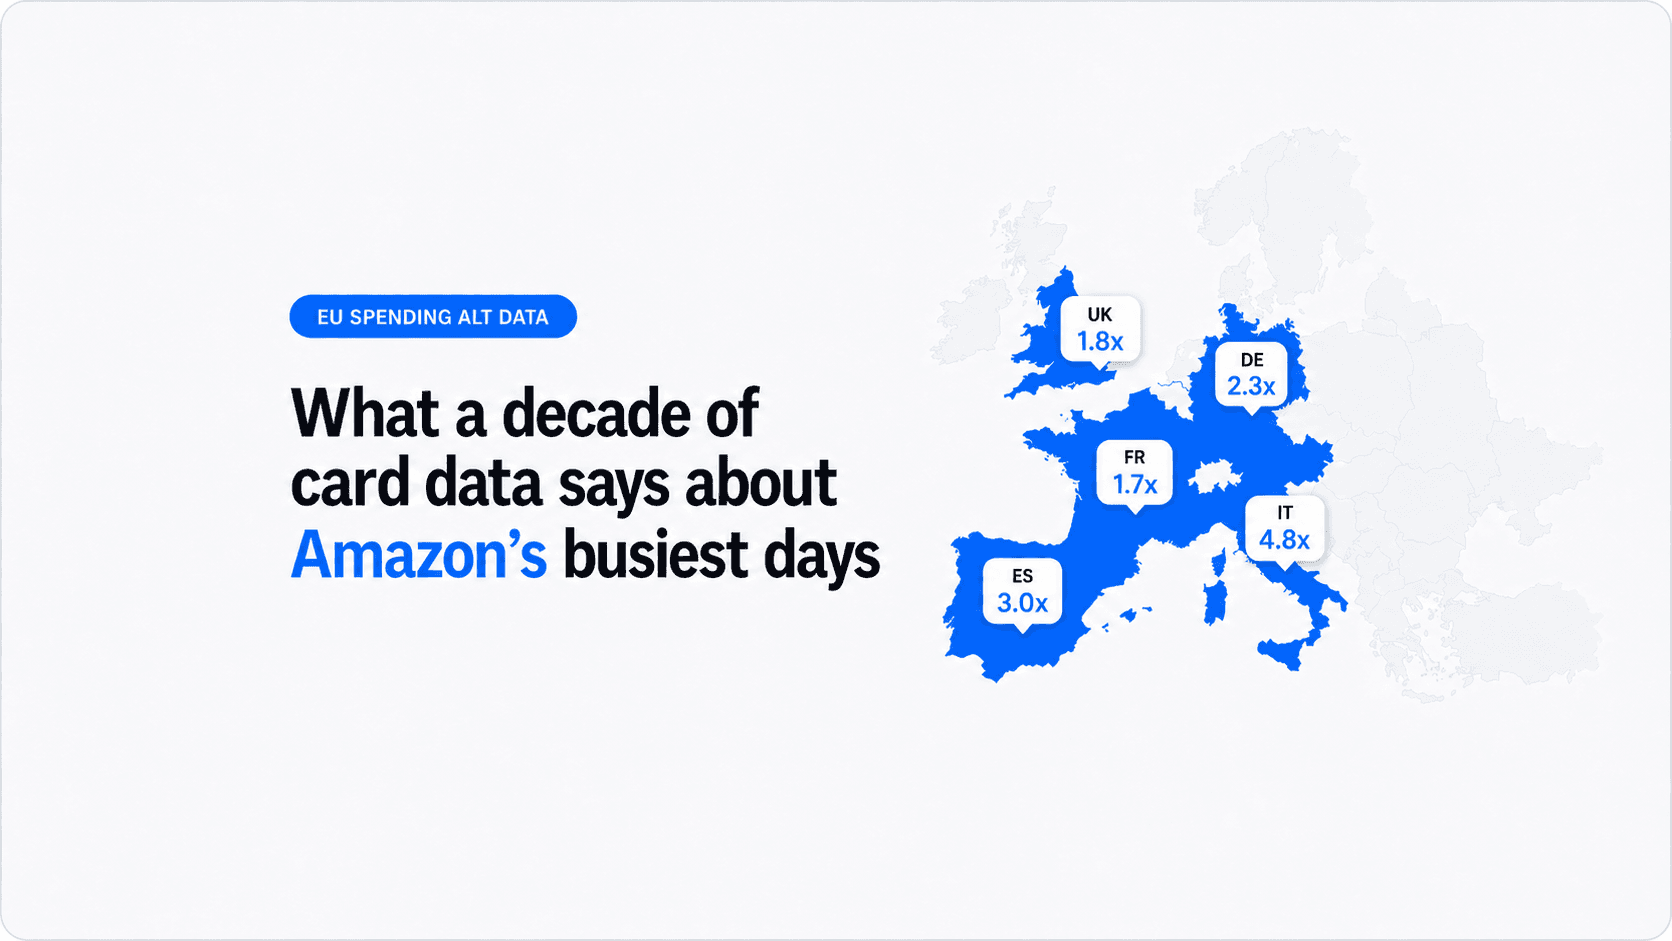
Italy goes absolutely berserk for Prime Day. Italian card spend on the 16th of July was 4.8× its surrounding July baseline. No other country is close. Spain is second at 3.0×, Germany third at 2.3×. The UK and France barely notice, both coming in under 2×.
Black Friday is the opposite. Every country's peak-day lift sits in a narrow 1.3× to 2.0× band. That isn't because Europeans don't care about Black Friday; it's because Black Friday is a plateau rather than a single-day manufactured event. You can only push so much of a week-long sale onto one day. Prime Day, by design, concentrates into a 24-hour window and the peak is much more extreme.
So the country difference isn't really "Italy likes Prime Day, the UK likes Black Friday". It's that Prime Day is genuinely a single-day phenomenon in Italy and Spain and barely a bump in France and the UK, whereas Black Friday looks much the same everywhere.
Why the Italy/Spain tilt? I don't know, but here's a guess: Prime Day is a brand event, not a price event. It works best where Amazon is the default reference point for online retail, which is more true in Italy and Spain than in the UK or France. In the UK, price-led Black Friday sweeps up every retailer simultaneously; in Italy, Amazon has less direct competition, so the single-retailer holiday lands harder. That's a guess, and a proper answer would need merchant-level data we haven't pulled yet. The shapes in the chart are the fact; the reason is still a hypothesis.
Now the twist.
The raw time series at the top of this post shows the biggest days clustered in the last two years. That looks like growth (and Amazon has been growing), but it's also a trick of the panel.
Our data is a panel of cards. In January 2016 we were tracking roughly 70,000 active cards across Europe. In March 2026 we're tracking around 940,000. Both the number of cards in our data, and the share of those cards' total spend that goes to Amazon, have grown. The headline growth in Amazon's daily takings in the panel is roughly 8× over a decade. The real growth in Amazon EU retail is much less than that. Most of the apparent growth is us tracking more cards.
The clean fix is to divide by the number of active cards in the panel each day. That way 2016 and 2024 are compared on the same scale. Do that, and rank the top 10 days in the whole decade:
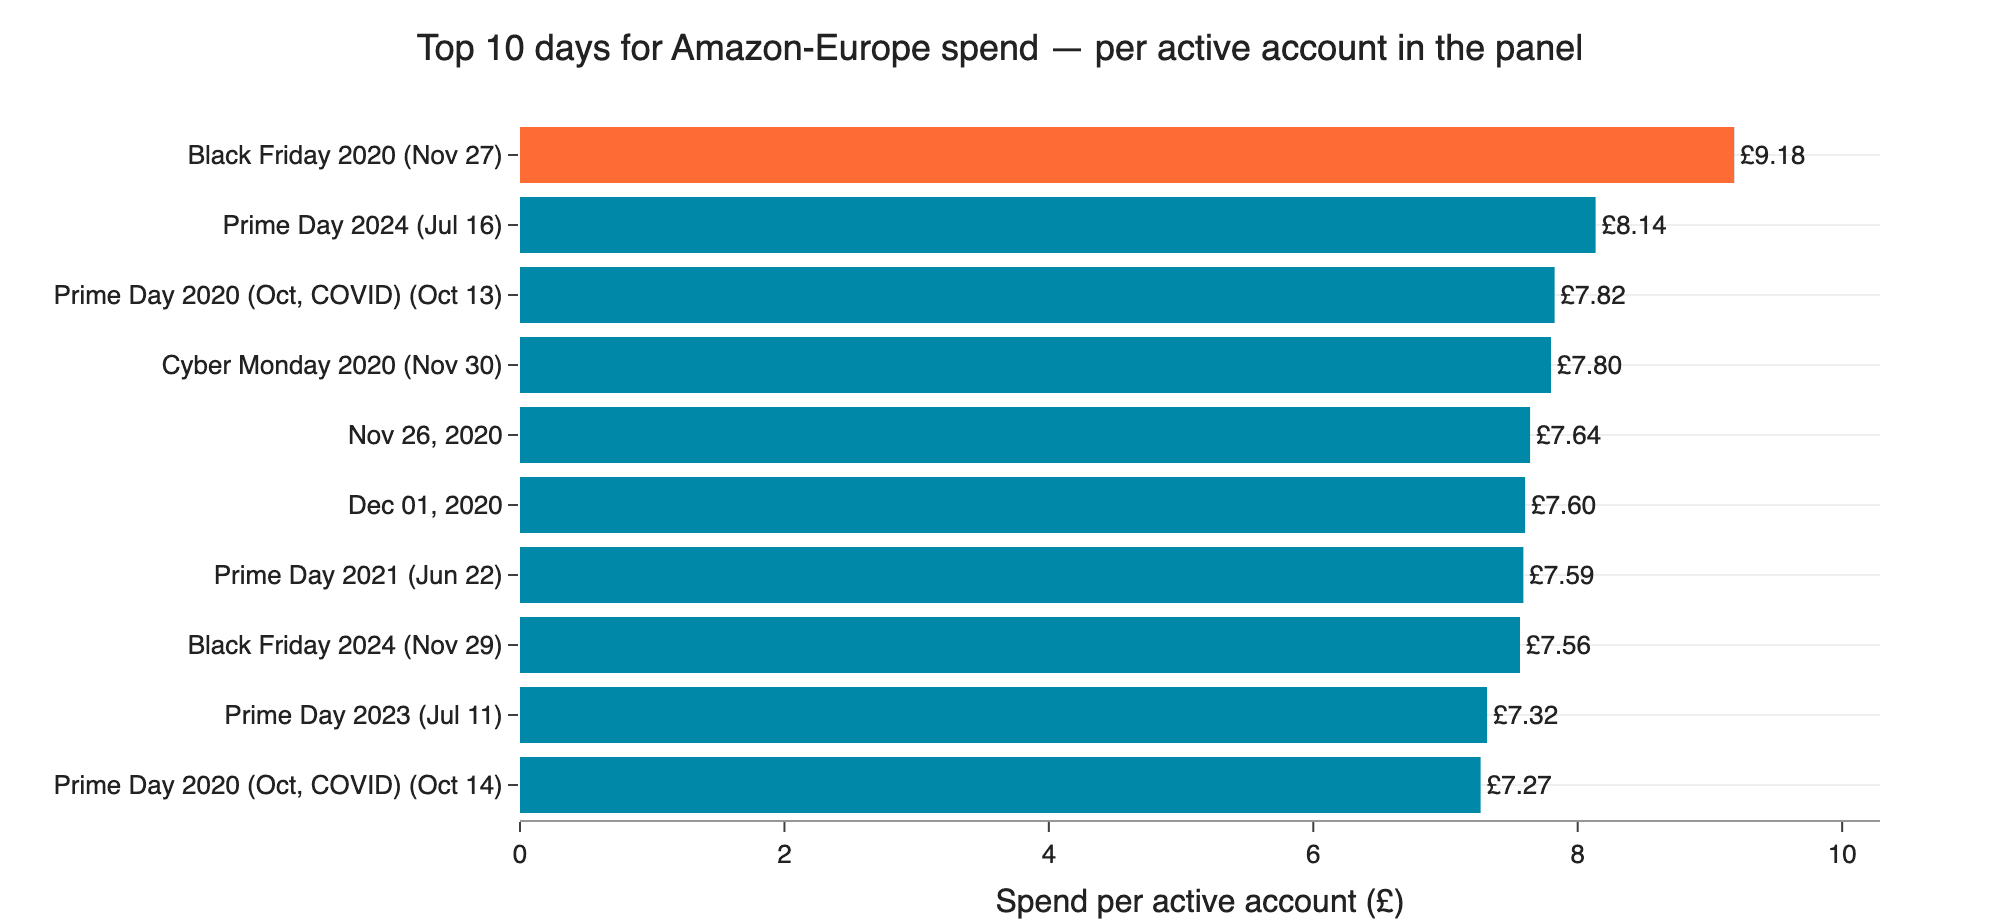
The biggest day in ten years of European card data is 🥁
Black Friday 2020.
2020 was the year Amazon pushed Prime Day to October because of the pandemic. It was the year lockdown pushed home delivery from a convenience into a necessity. The bizarre October Prime Day was bigger (per-active-card) than any July Prime Day before 2024. And the late-November Black Friday was bigger than all of them. Four of the top ten days in the decade are in a six-week window in late 2020.
You wouldn't spot this from the raw spend chart, because 2020 looks modest next to 2024–2025. Once you control for panel size, the reality is the opposite: 2020 was off the charts, and the post-2020 years have been slowly catching up with what happened during the lockdown.
A few things that will trip you up if you try to do this analysis yourself.
amazon uk, amazon germany, Whole Foods, Twitch, Ring, Kindle, Audible, AWS, Amazon Pay. For a retail seasonality story, you want the amazon.xx shopping sites. Amazon Pay, in particular, shows up as positive card flow because it's a payment processor; including it would make your numbers wrong in a way that is easy to miss.twenty_eight_day_rolling_total_accounts (or similar), and your numbers will be comparable.None of this is rocket science, but getting it right is the difference between a chart that tells the truth and one that tells a plausible-looking lie.
The code is all available on GitHub here.
This content is for educational purposes only. Nothing in this post constitutes investment advice or a recommendation to buy or sell any securities or other financial instruments. Massive is a market data provider, not a broker-dealer, exchange, or investment adviser. Market data accessed through Massive may originate from third-party exchanges and data providers or may be derived or calculated by Massive; in either case, it is subject to the applicable terms of your Massive subscription agreement. The data and code samples provided by Massive are offered on an "as-is" basis without any warranty of accuracy, completeness, or timeliness. You are solely responsible for your use of the data provided by Massive and for compliance with all applicable terms and conditions, laws, and data licensing requirements.

Rian Dolphin
rian
See what's happening at Massive
Massive US stock data is now available to AI agents via x402. Pay per request in USDC on agent.massive.com, with no account or API key. Built with Coinbase.
editor

Starting August 17, 2026, Cboe's Options Exchange is extending trading hours for select single-stock equity options with a morning GTH session (7:30–9:25 am ET) and Curb session (4:00–4:15 pm ET).

cole

A SEC 8-K API that labels what actually happened. Query filings by event type (CEO departures, cybersecurity incidents, M&A), with source-cited tags.
rian