
Massive Adds x402 Payments Access for AI Agents with Coinbase
Massive US stock data is now available to AI agents via x402. Pay per request in USDC on agent.massive.com, with no account or API key. Built with Coinbase.

editor
Introducing
Feb 18, 2026
Massive has launched new Splits and Dividends API endpoints. These updates include major enhancements like the historical_adjustment_factor for simpler historical price normalization, standardized symbology aligned with price data, improved event categorization, and cleaner datasets by removing unsupported tickers (e.g., mutual funds). We've deprecated the old splits and dividends endpoints in favor of these improved versions. We encourage you to start using the new ones today for better historical analysis, price adjustments, and data consistency.
These endpoints are available to all plans. If you do not already have a Massive account, you can sign up for one here.
Stock splits are corporate actions that alter a company's share structure without changing its overall market value or the proportional ownership of shareholders. In a forward split, the number of shares increases while the price per share decreases proportionally, often to boost liquidity and make the stock more accessible to investors. Reverse splits reduce the number of shares and increase the price per share, sometimes to meet exchange listing requirements or enhance perceived value. Stock dividends function similarly to forward splits by distributing additional shares to existing holders. These events impact how historical price data is interpreted, requiring adjustments to ensure accurate comparisons over time, such as normalizing past prices to reflect the current share basis.
To demonstrate the new Splits endpoint, let's use Apple (AAPL) as an example, which has undergone several splits in its history. You'll need an API key from Massive.com. Here's how to retrieve splits data using Python and the Massive client-python library:
import print
from massive import RESTClient

client = RESTClient("YOUR-API-KEY")

splits = []
for s in client.list_stocks_splits(ticker="AAPL"):
    splits.append(s)
print(splits)
This code fetches the latest stock splits for AAPL. The response includes key details like the execution date, split ratio (split_from and split_to), adjustment type, and the historical_adjustment_factor, which is crucial for adjusting historical data. For instance, the output looks like this:
[
    StockSplit(adjustment_type='forward_split',
               execution_date='2020-08-31',
               historical_adjustment_factor=0.25,
               id='E36416cce743c3964c5da63e1ef1626c0aece30fb47302eea5a49c0055c04e8d0',
               split_from=1.0,
               split_to=4.0,
               ticker='AAPL'),
    StockSplit(adjustment_type='forward_split',
               execution_date='2014-06-09',
               historical_adjustment_factor=0.035714,
               id='E91a6b74ca1a9dcbce26a1f34e24ae26ba2c6359822ccf901ecd827f419137654',
               split_from=1.0,
               split_to=7.0,
               ticker='AAPL'),
    StockSplit(adjustment_type='forward_split',
               execution_date='2005-02-28',
               historical_adjustment_factor=0.017857,
               id='E90a77bdf742661741ed7c8fc086415f0457c2816c45899d73aaa88bdc8ff6025',
               split_from=1.0,
               split_to=2.0,
               ticker='AAPL')
]
These factors make it straightforward to adjust for splits in your datasets.
To see the impact of splits, we can use the Custom Bars (OHLC) endpoint, which supports split adjustments via the adjusted=true parameter. Let's fetch daily aggregates for NVDA around a split date, first without adjustments:
from massive import RESTClient

client = RESTClient('YOUR-API-KEY')

aggs = []
for a in client.list_aggs(
    "NVDA",
    1,
    "day",
    "2024-01-10",
    "2024-06-24",
    adjusted=False,
    limit=50000,
    sort='desc',
):
    aggs.append(a)

print(aggs)
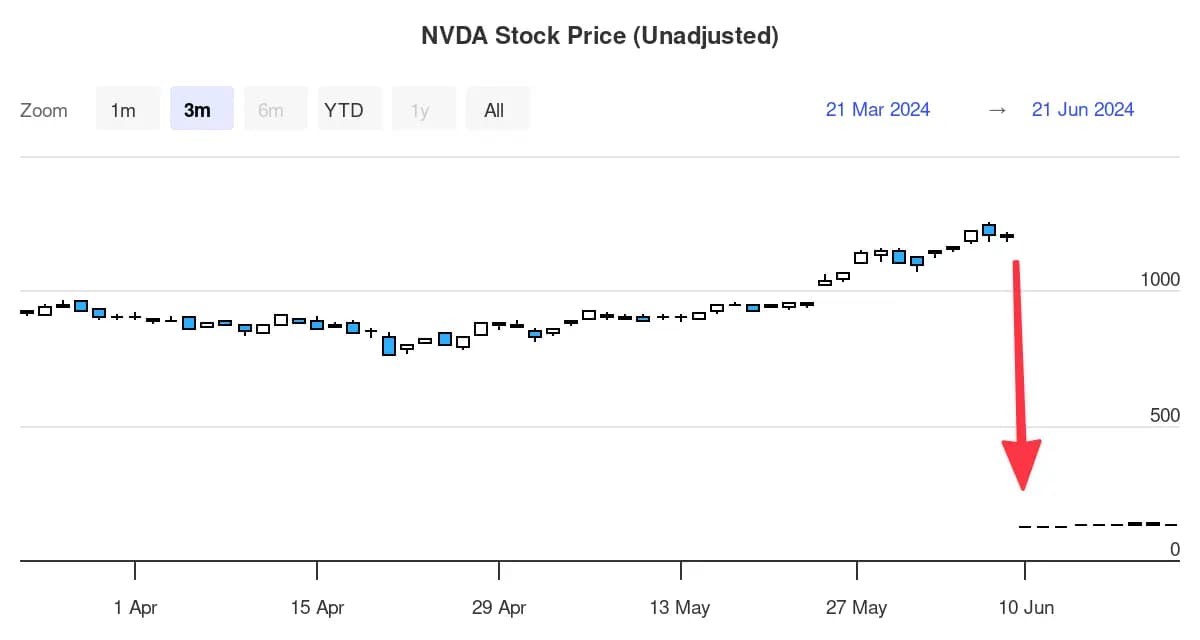
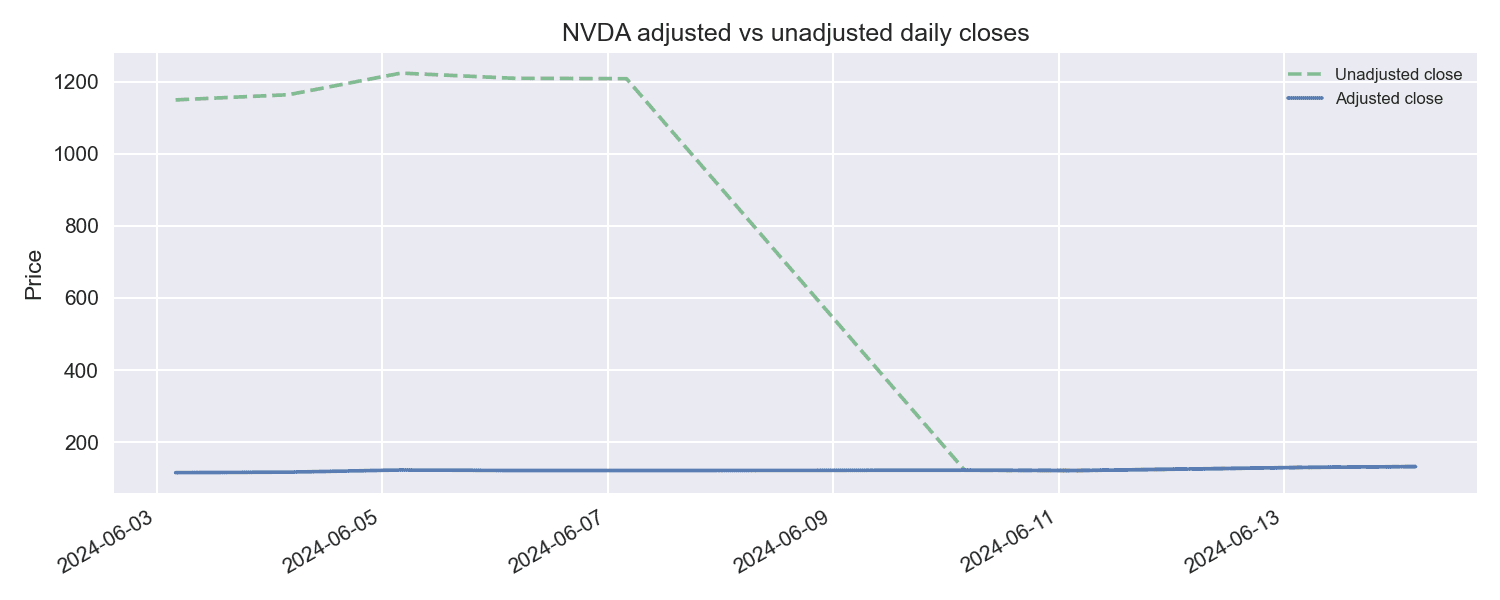
In the script above, we query daily aggregate data for Nvidia without adjusting for the stock split. With adjusted=False, the data reflects the share price as originally recorded each day. This results in significant price changes on the dates when stock splits occurred. For instance, on June 10, 2024, there was a 10-for-1 stock split for Nvidia. In the unadjusted data, you can observe the price appearing to drop dramatically from around $1,200 to $120, which could be misleading without knowledge of the split.
Now, let's retrieve the adjusted aggregate data for Nvidia over the same period which is the default mode. Adjusted data accounts for any stock splits by recalibrating the historical prices, ensuring that the analysis reflects a true and consistent valuation of the stock across time.
from massive import RESTClient

client = RESTClient('YOUR-API-KEY')

adjusted_aggs = []
for a in client.list_aggs(
    "NVDA",
    1,
    "day",
    "2024-01-10",
    "2024-06-24",
    adjusted=True,
    limit=50000,
    sort='desc',
):
    adjusted_aggs.append(a)

print(adjusted_aggs)
In the script above, we use the same parameters as before but set adjusted=True to retrieve data that has been adjusted for stock splits.
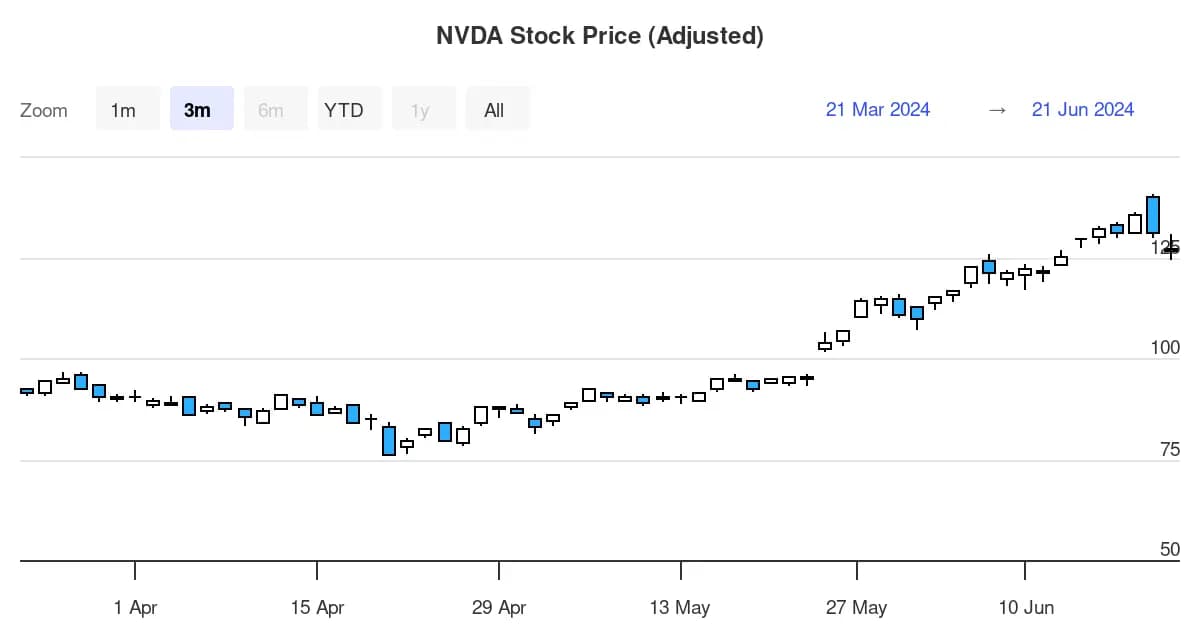
The adjusted data smooths out the split effect by recalibrating historical prices, providing a consistent view for trend analysis. For custom flat files, use the historical_adjustment_factor from the Splits endpoint instead.
Dividends represent distributions of a company's earnings to shareholders, often paid regularly to provide income alongside potential capital gains. Key aspects include the cash amount per share, frequency (e.g., quarterly), and type (such as recurring for standard payouts or special for one-time events). On the ex-dividend date, the stock price typically drops by approximately the dividend amount, as new buyers are not entitled to it. This can affect historical price continuity, so adjustments are needed to normalize data and account for these drops, enabling better total return calculations and strategy development.
Using AAPL again, which pays quarterly dividends, here's how to fetch data with the new Dividends endpoint:
from massive import RESTClient

client = RESTClient("YOUR-API-KEY")

dividends = []
for d in client.list_stocks_dividends(ticker="AAPL", limit="2", sort="ex_dividend_date.desc"):
    dividends.append(d)
print(dividends)
This retrieves historical dividends, including dates, amounts, types, frequencies, and the historical_adjustment_factor for price normalization. A sample output for recent entries might include:
[
    StockDividend(cash_amount=0.26,
                  currency='USD',
                  declaration_date='2026-01-29',
                  distribution_type='recurring',
                  ex_dividend_date='2026-02-09',
                  frequency=4,
                  historical_adjustment_factor=0.999065,
                  id='Ea9c1921173ef4be798ca05a1f7015b4ae452bfcf7d641a3a63c1fd852f1eaf05',
                  pay_date='2026-02-12',
                  record_date='2026-02-09',
                  split_adjusted_cash_amount=0.26,
                  ticker='AAPL'),
    StockDividend(cash_amount=0.26,
                  currency='USD',
                  declaration_date='2025-10-30',
                  distribution_type='recurring',
                  ex_dividend_date='2025-11-10',
                  frequency=4,
                  historical_adjustment_factor=0.998098,
                  id='E46d7ebeffba0ae65cff4eb03497ce2a27de1fba5a67b5cda1ca0a8b6eedf5c8c',
                  pay_date='2025-11-13',
                  record_date='2025-11-10',
                  split_adjusted_cash_amount=0.26,
                  ticker='AAPL')
]
The split_adjusted_cash_amount helps compare dividends across split events, while the historical_adjustment_factor enables manual adjustments until native dividend support arrives in aggregates.
The new historical_adjustment_factor simplifies normalizing historical prices by providing a cumulative multiplier that adjusts past data to the current share basis, making it easier to compare across splits and dividends. For example, with splits, if you have an unadjusted AAPL close price of $157.92 from January 2, 2019 (before the 2020 4-for-1 split), multiply it by the factor from that split (0.25) to get the normalized price: $157.92 × 0.25 = $39.48.
Similarly for dividends, take a hypothetical $200 close on May 9, 2025 (before a $0.26 ex-dividend on May 12), and multiply by its factor (about 0.9977) to offset the drop: $200 × 0.9977 ≈ $199.54. Since factors are multiplicative, combine them for full adjustments (split first, then dividend), which is perfect for flat files if you are trying to compute these values yourself.
We have created a demo to showcase the new endpoints visually. You can get access to the code for this example over in our GitHub community repository. There is also a detailed README with instrucitons on setting up and running the demo.
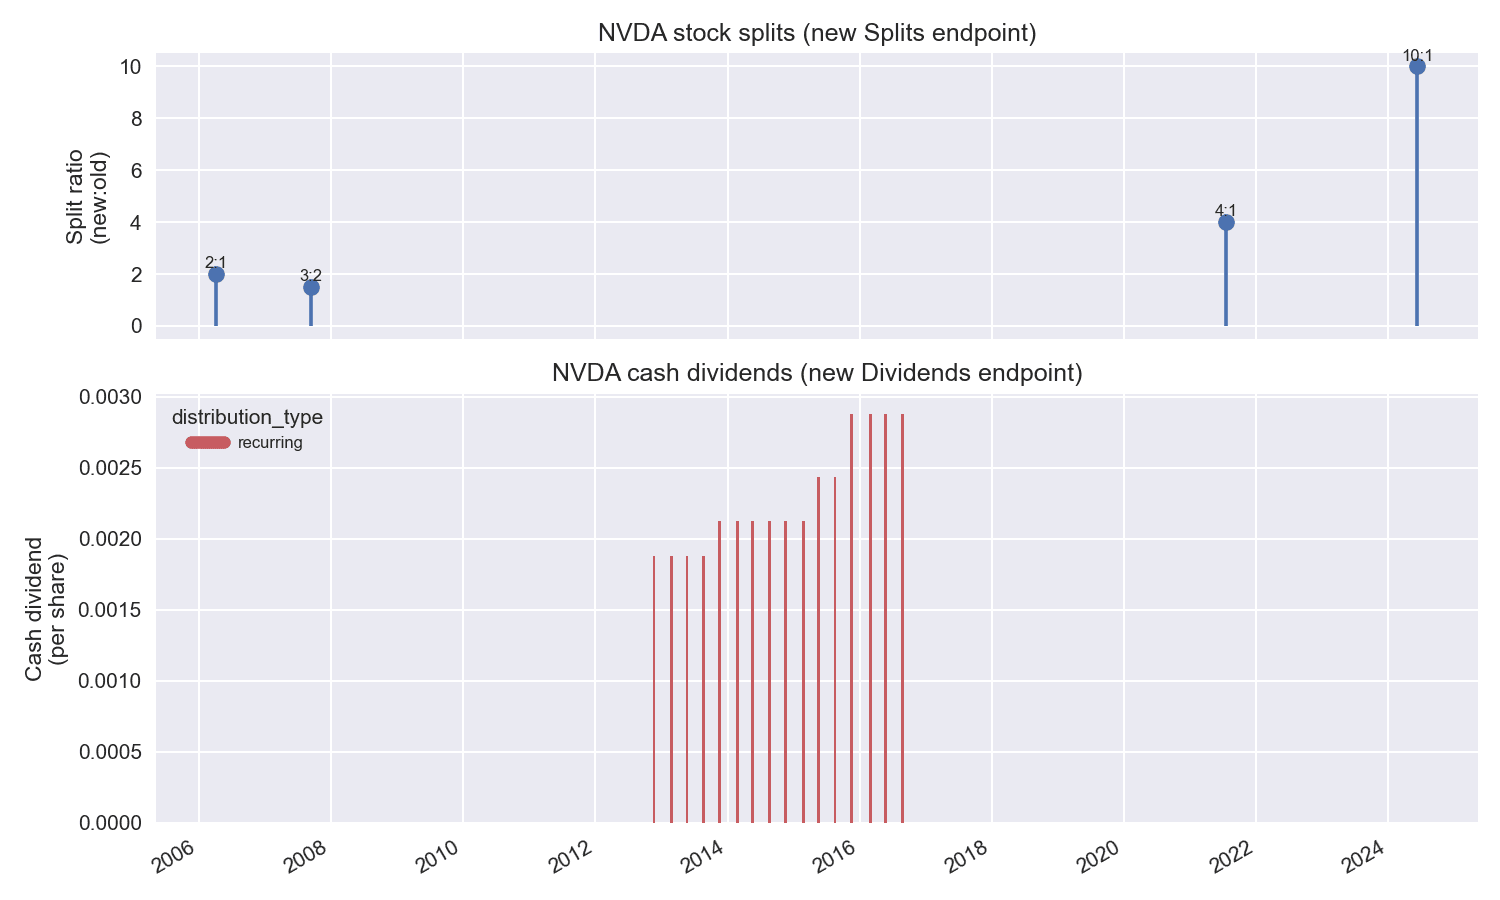
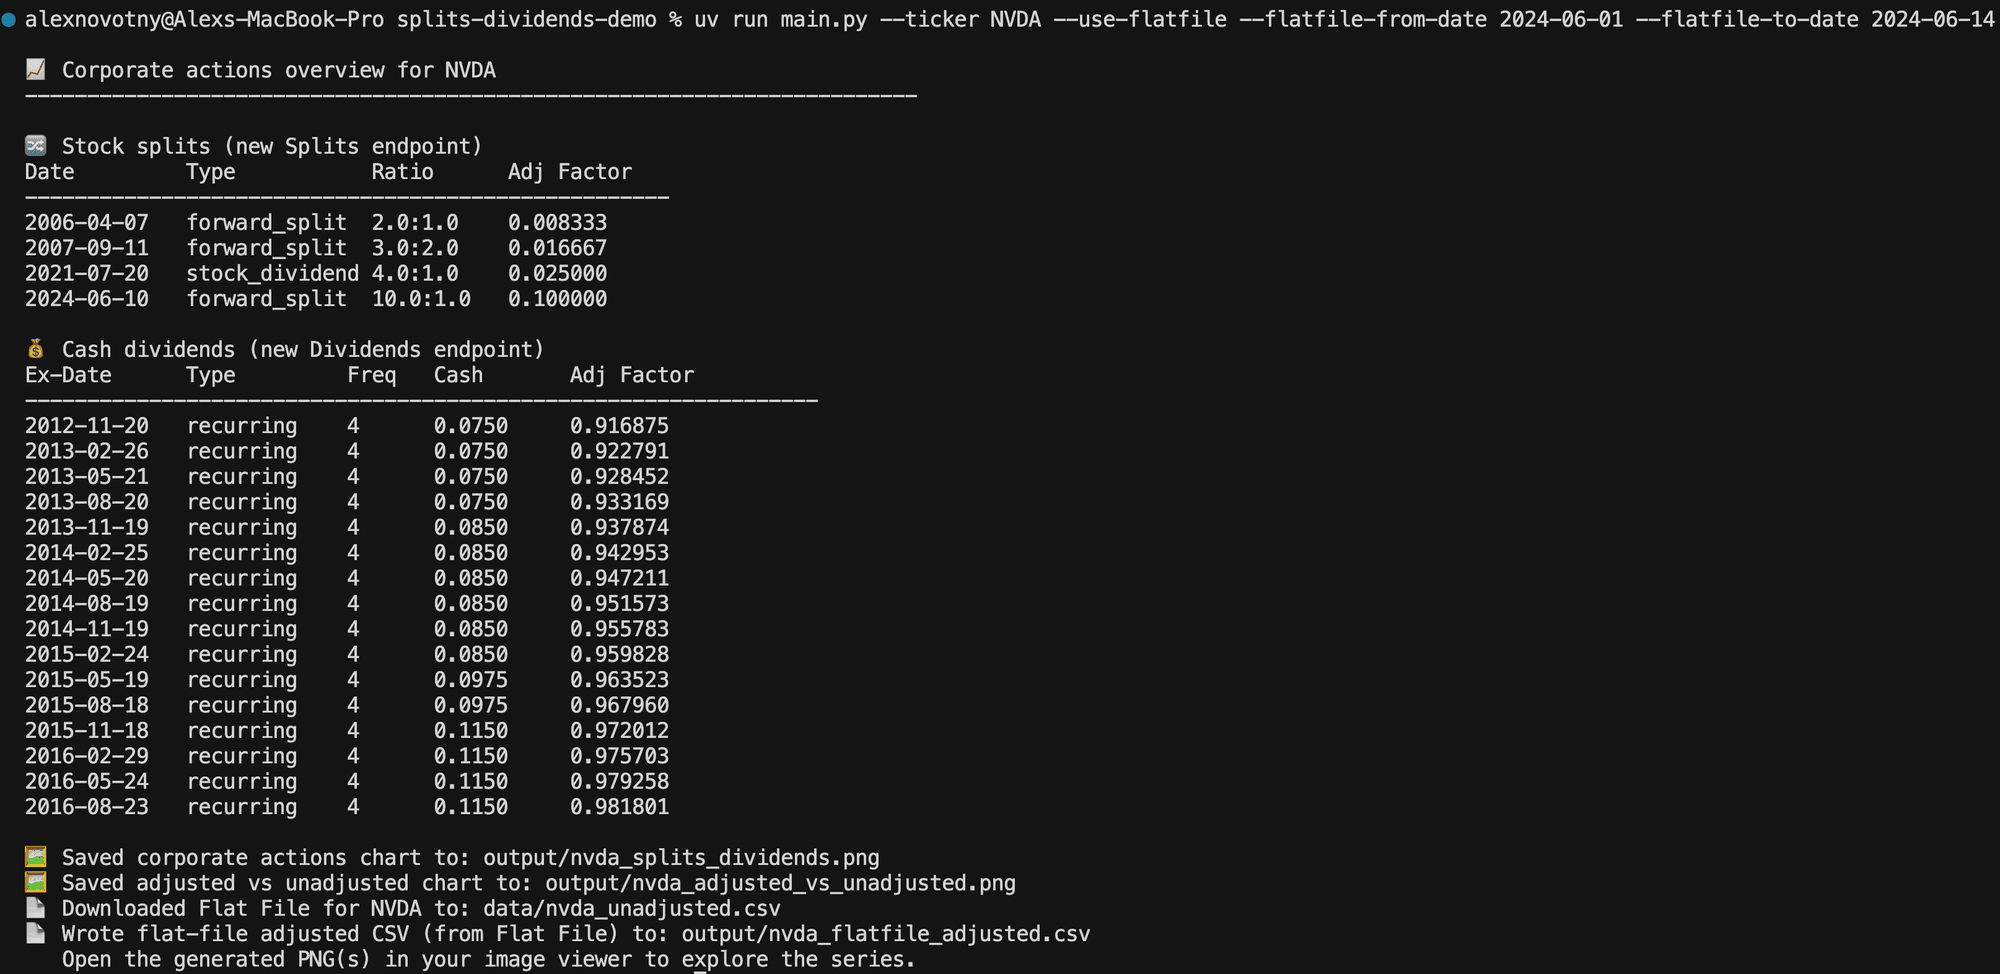
We hope this overview highlights the power of our new Splits and Dividends endpoints. Start integrating them today for more accurate financial analysis. Sign up at Massive.com for an API key, explore the full documentation, checkout the demo, and reach out with feedback.
This content is for educational purposes only and does not constitute investment advice or a recommendation to buy or sell any securities. Massive is a market data provider, not a broker-dealer or investment adviser. The data and code samples provided by Massive are offered on an "as-is" basis without any warranty of accuracy, completeness, or timeliness. Options trading involves substantial risk of loss and is not suitable for all investors. You are solely responsible for your use of the data provided by Massive, this information, and for compliance with all applicable laws and data licensing requirements.
Justin
editor
See what's happening at Massive
Massive US stock data is now available to AI agents via x402. Pay per request in USDC on agent.massive.com, with no account or API key. Built with Coinbase.
editor

Starting August 17, 2026, Cboe's Options Exchange is extending trading hours for select single-stock equity options with a morning GTH session (7:30–9:25 am ET) and Curb session (4:00–4:15 pm ET).

cole

A SEC 8-K API that labels what actually happened. Query filings by event type (CEO departures, cybersecurity incidents, M&A), with source-cited tags.

rian