
Massive Adds x402 Payments Access for AI Agents with Coinbase
Massive US stock data is now available to AI agents via x402. Pay per request in USDC on agent.massive.com, with no account or API key. Built with Coinbase.

editor

Introducing
Mar 23, 2026
TL;DR — Key Federal Reserve labor market indicators: unemployment rate, labor force participation, average hourly earnings, and job openings are now accessible through a simple, unified API.
The Labor Market endpoint delivers four core Fed indicators in a single, filterable response, and is updated monthly as new data is released.
Endpoint: GET /fed/v1/labor-market
Returns:
unemployment_rate: Civilian unemployment as a percentage of the labor forcelabor_force_participation_rate: Share of working-age civilians employed or actively seeking workavg_hourly_earnings: Average hourly pay across private non-farm workers (USD)job_openings: Total non-farm job openings (in thousands)Coverage goes back to 1948-01-01.
Macro research runs on labor market data. Unemployment, participation rates, average earnings, job openings show up in practically every Fed decision, economic forecast, and workforce model that matters.
The fewer sources your pipeline depends on, the less there is to break. Labor market data is now part of the same platform you're already using for equities, options, indices and crypto. One endpoint, same structure, no new service or integration to maintain.
Here's a simple example to pull all monthly statistics from 2025:
Python sample:
from massive import RESTClient
client = RESTClient("YOUR_API_KEY_HERE")
items = []
for item in client.list_labor_market_indicators(
    date_gte="2024-12-01",
    date_lte="2025-12-01",
    sort="date.asc",
    limit="100",
):
    items.append(item)
print(items)
Sample response:
{
  "status": "OK",
  "request_id": "abc123",
  "results": [
    {
      "date": "2024-12-01",
      "unemployment_rate": 4.2,
      "labor_force_participation_rate": 62.5,
      "avg_hourly_earnings": 35.06,
      "job_openings": 8098
    }
  ]
}
Note: job_openings is reported in thousands, so 8098 represents approximately 8.1 million open positions.
Use a YYYY-MM-DD formatted date for the date parameter when performing point-in-time lookups.
Python sample:
items = []
for item in client.list_labor_market_indicators(date="2020-04-01"):
    items.append(item)
print(items)
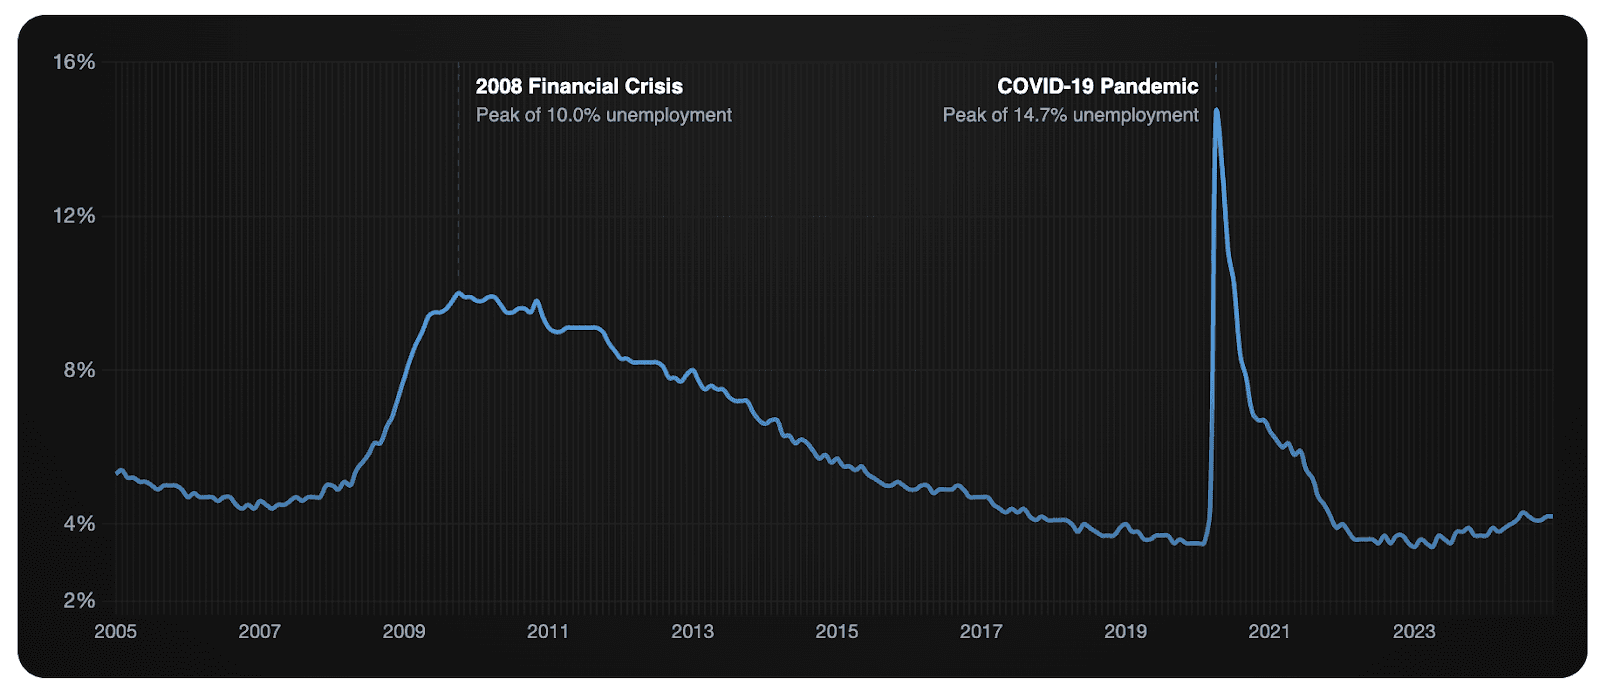
April 2020 is a useful reference point, where unemployment hit 14.8% that month, the highest recorded rate since the series began in 1948.
Use date.gte and date.lte to query a window of statistics.
Python sample:
items = []
for item in client.list_labor_market_indicators(
    date_gte="2005-01-01",
    date_lte="2024-12-01",
    sort="date.asc",
):
    items.append(item)
print(items)
This returns 240 monthly statistics ready to pipe directly into a charting library or time series model like the example below.
Use date.any_of to cherry-pick observations across time:
Python sample:
items = []
for item in client.list_labor_market_indicators(
    date_any_of="2020-04-01,2021-04-01,2022-04-01,2023-04-01,2024-04-01",
    sort="date.asc",
):
    items.append(item)
print(items)
This pattern works well for year-over-year comparisons or building summary tables across economic cycles.
Macroeconomic dashboards: Surface current unemployment, participation, and earnings growth in a single call. No pre-joining required, no stale exports to refresh.
Econometric research: Pull the full historical series back to 1948 for time series modeling, labor market forecasting, or academic research. The data maps directly to FRED series (UNRATE, CIVPART, CES0500000003, JTSJOL) for easy cross-referencing.
Newsroom & policy reporting: Programmatically retrieve the latest figures the moment a new Fed release drops, without manually checking FRED or waiting on a data team.
If you'd rather query this data in plain English than write code, the Massive MCP server gives Claude and other MCP-compatible AI tools access to the full Massive API. Ask questions like "what was the unemployment rate during the 2008 financial crisis?" and get answers without touching a query parameter.
The server supports Claude Code and Claude Desktop and is available on GitHub or through the browse connections section of Claude.
The full parameter reference is available at massive.com/docs/rest/economy/labor-market. If you're not yet a Massive customer, you can sign up and start querying at massive.com.
Disclaimer
This content is for educational purposes only and does not constitute investment advice or a recommendation to buy or sell any securities. Massive is a market data provider, not a broker-dealer or investment adviser. The data and code samples provided by Massive are offered on an "as-is" basis without any warranty of accuracy, completeness, or timeliness. You are solely responsible for your use of the data provided by Massive and for compliance with all applicable laws and data licensing requirements.

Cole Power
cole
See what's happening at Massive
Massive US stock data is now available to AI agents via x402. Pay per request in USDC on agent.massive.com, with no account or API key. Built with Coinbase.
editor

Starting August 17, 2026, Cboe's Options Exchange is extending trading hours for select single-stock equity options with a morning GTH session (7:30–9:25 am ET) and Curb session (4:00–4:15 pm ET).
cole

A SEC 8-K API that labels what actually happened. Query filings by event type (CEO departures, cybersecurity incidents, M&A), with source-cited tags.

rian